Vestaweather
May 2022
 One of my many hobbies is playing around with home automation. When I first heard about Vestaboard, I knew I wanted one and started thinking about ways to integrate it into my smart home. If you’re unfamiliar, it’s a messaging device that hangs on the wall and uses split-flap “bits” to show messages on a schedule or demand. These bits are stacks of plastic that quickly flip, making a delightful sound effect as they update. Think of it as a home version of a European train station departures board.
While home sick for a week in January 2022, I built a custom app that shows me the weather on request but leverages the unique constraints of the display to give me the forecast in a digestible way. I’m still playing around with it, but I’m pretty happy with it as it stands.
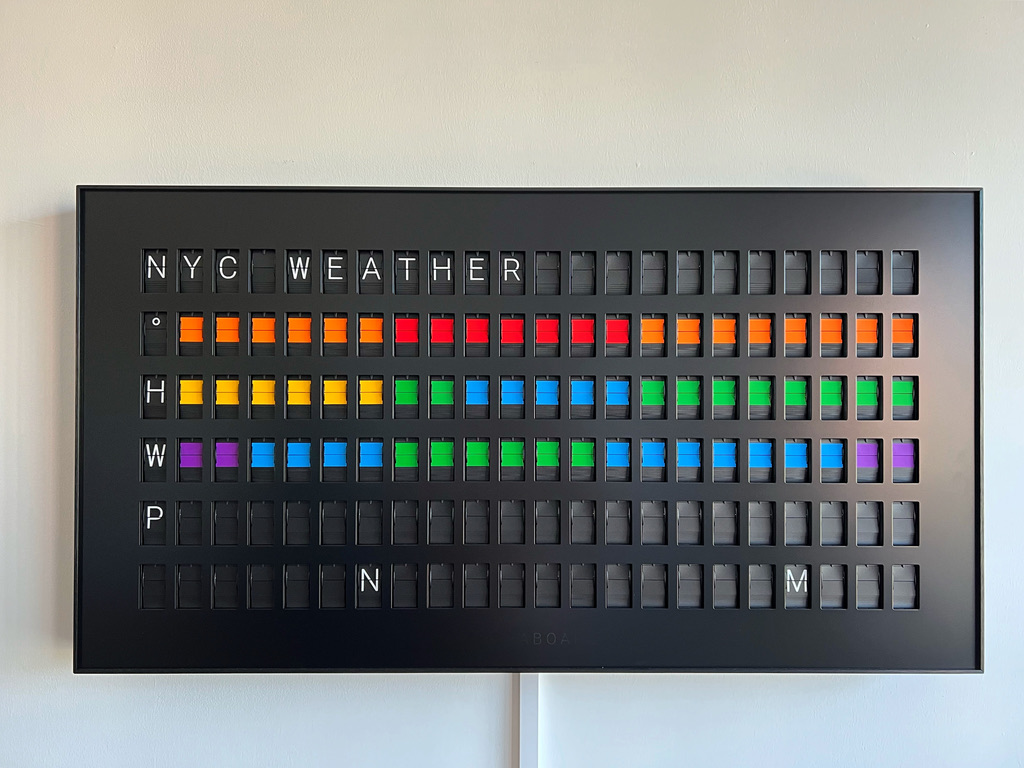
The key to reading the weather is understanding the order I decided to represent low to high measurements: ⬛️ 🟪 🟦 🟩 🟨 🟧 🟥 ◻️. Each column represents an hour of the day, starting with the current hour in the second column. N and M in the bottom row are visual anchors for noon and midnight. This means you can deduce the photo above shows an update that was posted in the 7 AM hour. Each row of color is a different weather condition: temperature, humidity, wind, and precipitation.
On the day this photo was taken, it was warm in the morning, becoming hot in the afternoon (though not extreme, that’d be white). Humidity was moderate, dipping in the afternoon but going back up a bit overnight. The wind was set to peak in the afternoon (though not very high overall), and there was no chance of rain all day. The colors intentionally don’t map to values because the goal was to give me a picture of the day without worrying about what a certain number means. That being said, I occasionally tweak the thresholds to give me more meaningful colors. I’ve even recently added a “cloud coverage” row so I know when to keep my shades closed, as my apartment turns into an oven on sunny days.
To get this to post to the Vestatobard, I visit a hard-coded URL, which routes to a Node server that gathers the weather data. I previously used DarkSky, so I migrated it to Apple’s weather API; that was a fun side exercise. Once the weather is grabbed and the message generated, the Node server sends it to the Vestaboard API. I connected this to my smart home through the iOS Shortcuts app. When I open my bedroom door first thing in the morning or whenever I tell Siri “Post the weather,” Shortcuts requests the URL, and the Vestaboard starts its delightful mechanical update. What you see in the above photo may not be initially obvious, but once you understand the colors, it makes much more sense.
Overall, it’s a fun little physical project in an increasingly digital world, and every time I open my bedroom door in the morning, I feel that little rush of dopamine that comes from seeing something I created. Well, that, and the fact that 132 bits flipping simultaneously in a 400 square-foot room is just startling enough to generate a hit of adrenaline.